Headcount scenarios
Projected headcount by scenario
On this sample, every scenario shrinks headcount over 12 months because monthly exits outpace hires at current rates. The attrition and hiring mix decides by how much: cutting attrition 20% and hiring 20% faster ends 43% to 69% above the current-rates path, depending on the department.
Where each department starts
| Department | Headcount | Attrition rate | Time to fill (days) | Cost per hire | Growth target |
|---|---|---|---|---|---|
| HR | 195 | 11.0% | 76 | $4,039 | 5.9% |
| Sales | 152 | 14.9% | 72 | $5,346 | 5.4% |
| IT | 178 | 12.8% | 56 | $6,644 | 5.9% |
| Finance | 184 | 11.4% | 44 | $5,583 | 4.3% |
| Operations | 188 | 10.7% | 89 | $6,552 | 4.4% |
| Marketing | 167 | 10.4% | 43 | $5,981 | 3.9% |
| Engineering | 169 | 13.1% | 42 | $7,248 | 4.2% |
| Product Development | 192 | 11.1% | 60 | $5,159 | 5.5% |
Demand forecast (Tableau)
A separate history-versus-forecast view of operations headcount lives on Tableau Public.
Open the forecast on Tableau Public
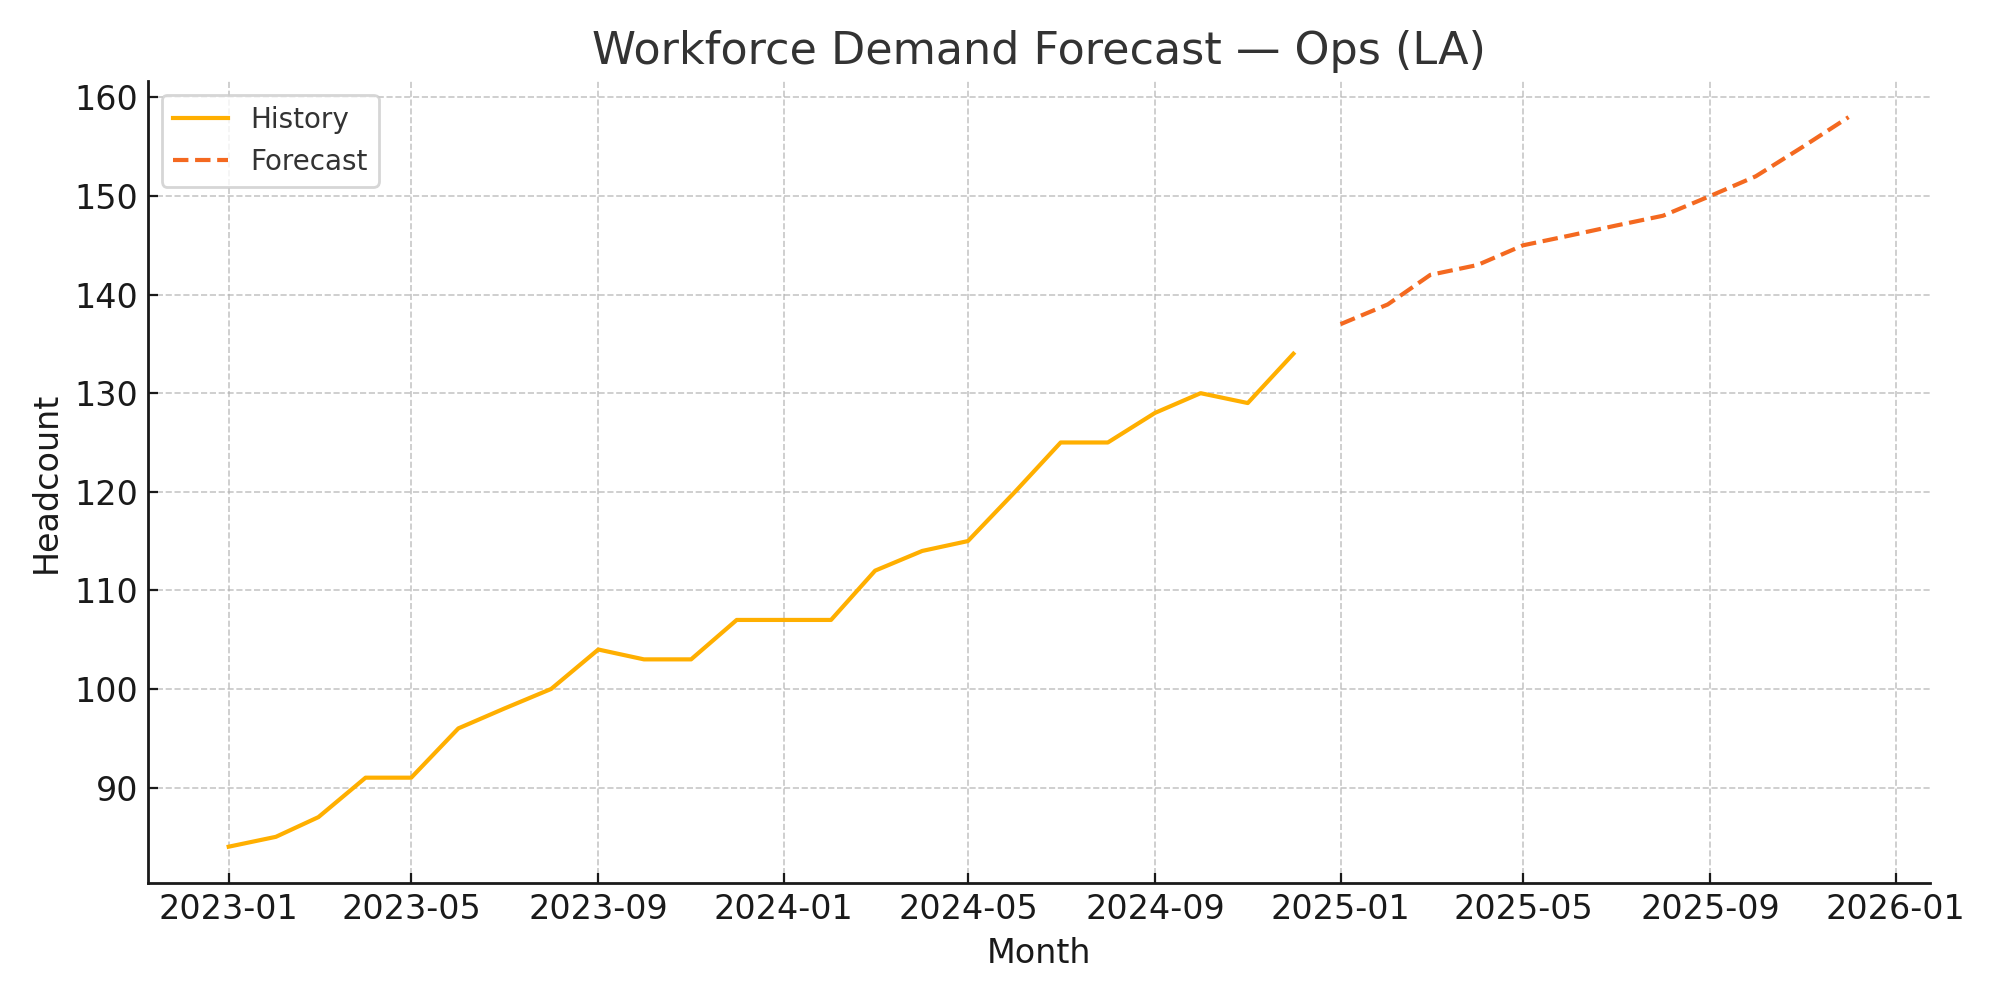
About the data. Scenario lines and the summary table are the sample data from the original interactive page. The “% above current rates” figures are recomputed from those same lines and match the original page’s numbers (it described them as “compared to the baseline”). The original page linked a CSV in a GitHub repo that no longer exists, so that link is gone.
Rebuilt from:
- interactive_cases_refined/workforce_planning_case.html (scenarios, summary table)
- workforce-forecast.html (Tableau embed)
- workforce_forecast_preview.png (forecast chart image)
More reports
Measuring Engagement Impact
Does engagement move productivity and turnover? A department-by-department look at the data, with the honest answer.
Open reportDiversity Metrics
Representation by department across race, gender and job level, in one consistent view.
Open reportHR Attrition Dashboard
Attrition rate, who left and when, and where satisfaction is lowest by age band and department.
Open report