What changed
Before and after the interventions
Early attrition is shown in percent; reporting effort and ramp-up are indexed so that before = 100.
90-day attrition after rollout
Attrition fell from 35% to 25% within six months of the onboarding redesign and manager enablement.
Which levers worked
Estimated uplift by intervention
Mentor assignment and a structured first day did the most for early-career cohorts; manager training mattered most where specific managers were the issue.
Data and method
- Data foundation: HRIS, ATS, LMS, survey and scheduling data joined into one governed dataset with PII masking, role-based access and small-cell suppression.
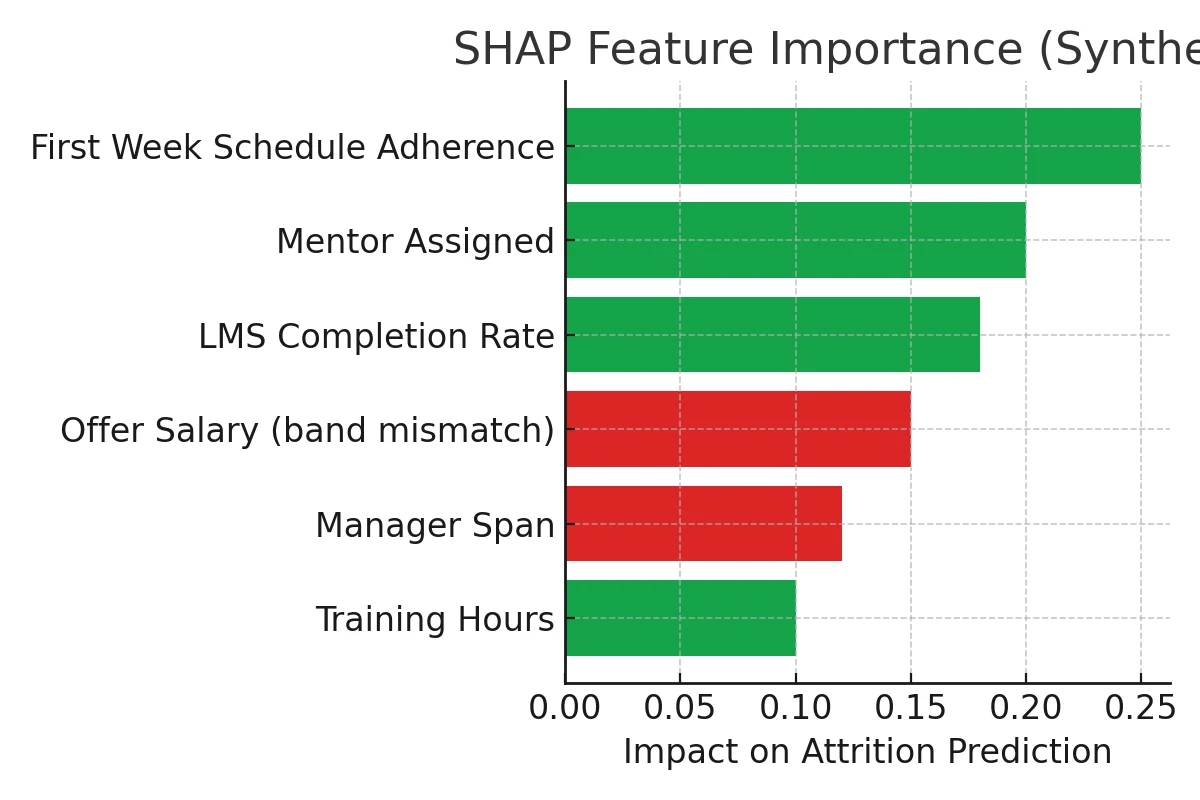
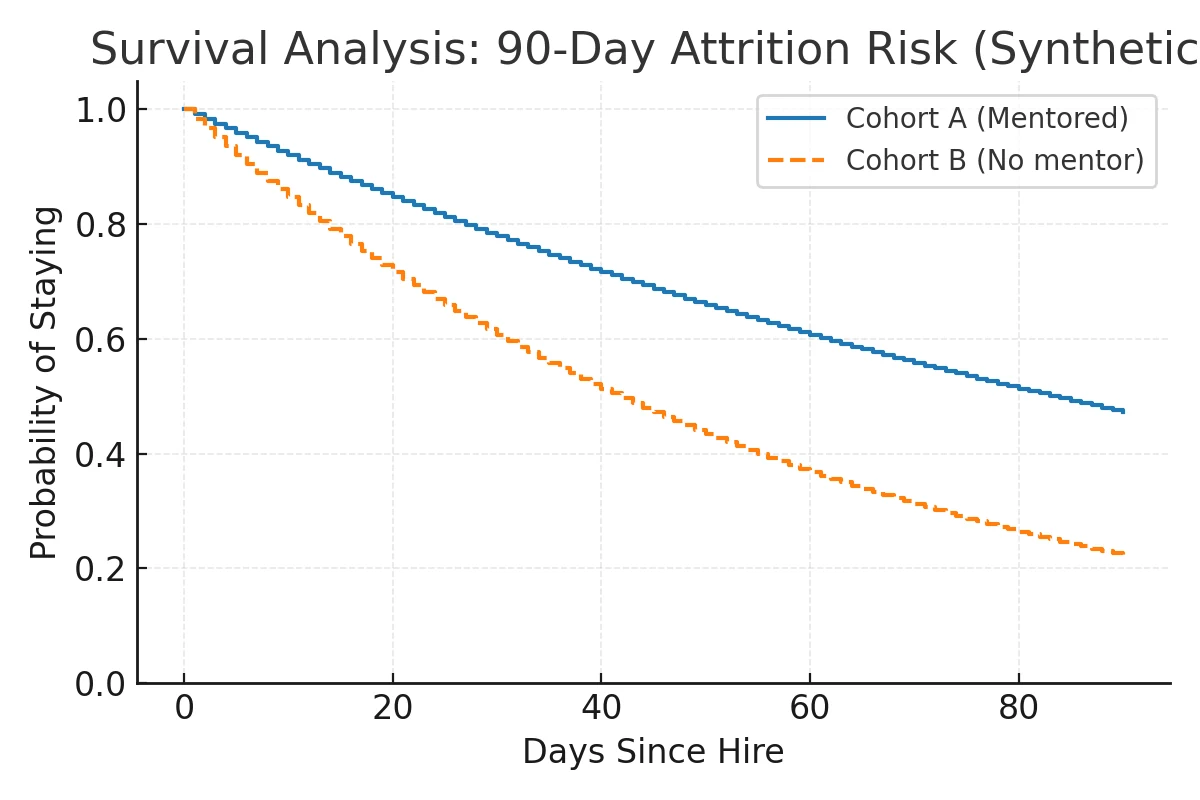
- Predictive: survival analysis (Cox proportional hazards) to see when risk peaks, and gradient boosting with SHAP values to surface drivers such as first-week schedule adherence, mentor assignment and pay-band misalignment.
- Uplift: a T-learner estimated the causal effect of each intervention by segment.
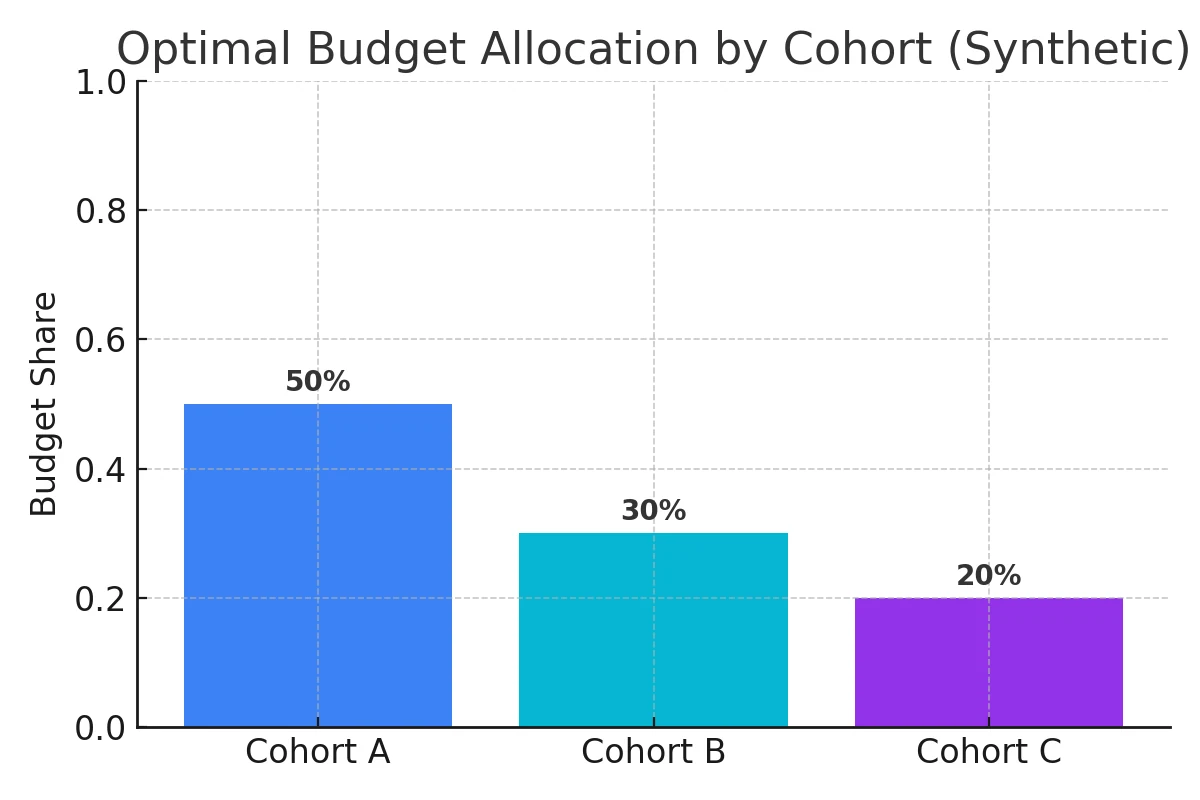
- Prescriptive: a linear program allocated budget across sites and cohorts to maximize retained days within cost and fairness limits. It recommended about 60% to onboarding redesign for the highest-risk cohorts and 40% to manager training.
Model outputs
The original analysis outputs, shown as published (synthetic data).
Results
Within one quarter of launch, early attrition fell 28% across the pilot groups, manual reporting time dropped about 40% thanks to automated pipelines and scorecards, and new-hire ramp-up improved 17% on productivity KPIs. Leaders got a clear answer on where to invest.
About the data. Charts use the sample data from the original interactive dashboard (the old site had two near-identical copies; this uses the version that also includes the uplift chart). Outcome figures are carried over unchanged from the original case study.
Rebuilt from:
- attrition_case_study.html (write-up, outcomes)
- assets/img/shap_summary.png, survival_curve.png, optimization_allocation.png (original model outputs)
- interactive_dashboards/reducing_90_day_attrition_dashboard.html (all three charts)
- interactive_cases_refined/ninety_day_attrition_case.html and prescriptive_attrition_case.html (earlier copies)
More reports
Workforce Planning & Forecast
Twelve-month headcount scenarios by department under different attrition and hiring rates, plus a live Tableau forecast.
Open reportMeasuring Engagement Impact
Does engagement move productivity and turnover? A department-by-department look at the data, with the honest answer.
Open reportDiversity Metrics
Representation by department across race, gender and job level, in one consistent view.
Open report